Menu Path |
SAP Menu > Tools > ABAP Workbench > Development > ABAP Editor |
Transaction code |
SE38 > Debugging |
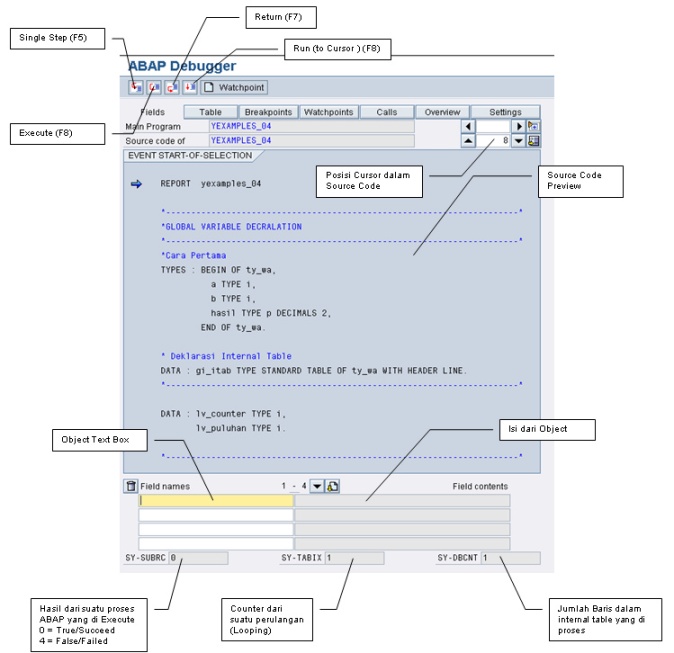
ABAP Debugger is one of SAP fitur which most used by ABAP'er to analize program/report made in SAP.
Main menus in ABAP Debuger which most used are:
1.Single Step (F5), it's used to enter inside subroutine or module.
2.Execute (F8), it's used to execute line coding one by one.
3.Return (F7), it's used to exit from subroutine.
4.Run (to Cursor) (F8), it's used to execute all line code program and only stop if there are icon"![]() "
"
These are bassic example to debug program.
1.Open t-code SE38
2.Choose YEXAMPLES_04
3.Run Program
4.Type "/h" at "Command Field"
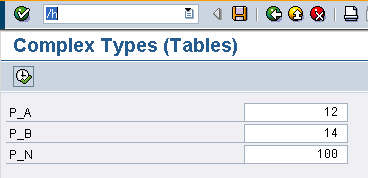
5.Press enter
6.Press button "![]() "
"
7.It will be enter ABAP Debuger menu like picture below :
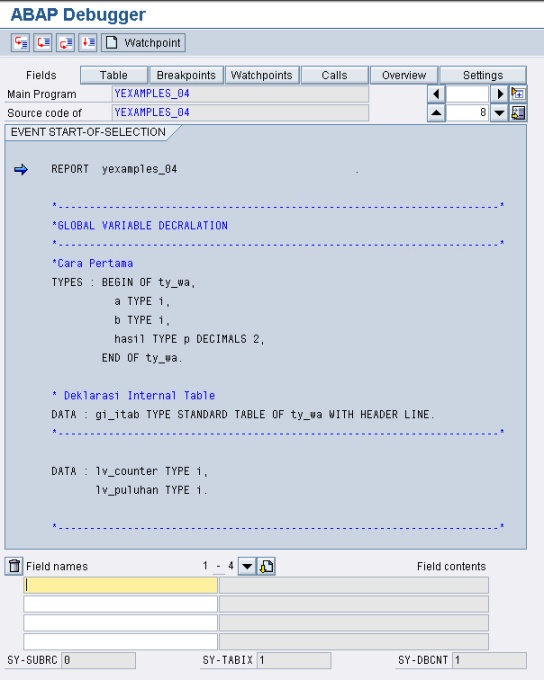
8.Click "![]() "
"
9.Type "gi_itab" at Field names and press enter
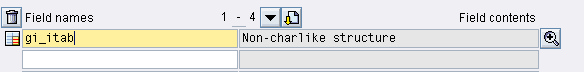
10. Double Click at "![]() " and will be appear "Internal Table" menu
" and will be appear "Internal Table" menu
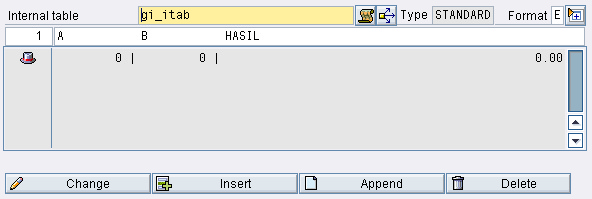
![]() = This is a row which define as Header Line
= This is a row which define as Header Line
" DATA : gi_itab TYPE STANDARD TABLE OF ty_wa WITH HEADER LINE. "
11.Click "![]() ", stop at coding " APPEND gi_itab."
", stop at coding " APPEND gi_itab."
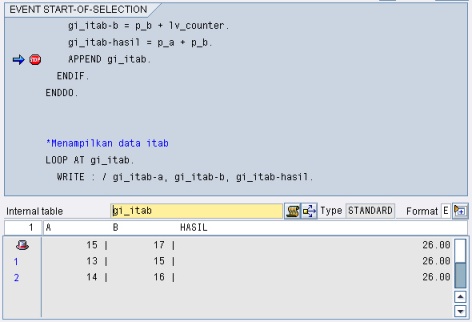
12.attent the Header Line, it will be filled like picture below :
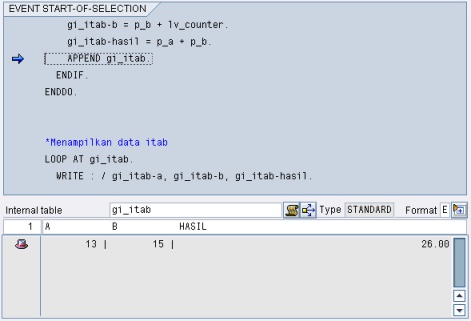
Notes: Before append the data, it place temporary at header line.
13.Click "![]() " to append data
" to append data
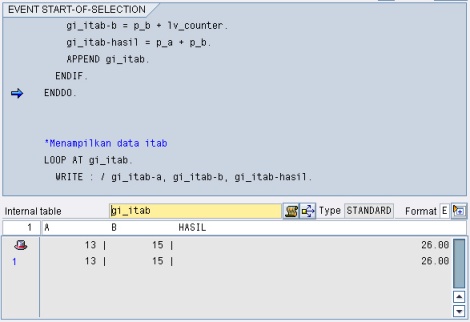
Notes:Data at Header Line are data at active row in gi_itab.
.
14.Now, double click on " APPEND gi_itab." so it will be appear Break Point like picture below
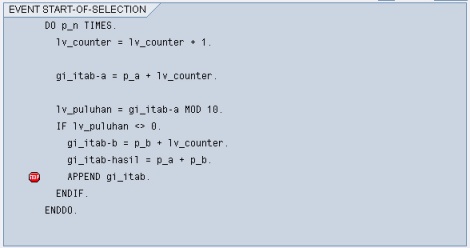 .
.
15.Then Click "![]() " once again, then cursor will jum into icon"
" once again, then cursor will jum into icon"![]() " inside repetition block coding
" inside repetition block coding
16.Now, Double Click at " APPEND gi_itab." or icon "![]() " to remove Break Point
" to remove Break Point
17.Then Click "![]() " to exit from ABAP Debugger
" to exit from ABAP Debugger
18.Finish